How to Setup PostgreSQL Monitoring in Kubernetes
 You don't need
monitoring
until you need it. But if you're running anything in production, you always need
it.
You don't need
monitoring
until you need it. But if you're running anything in production, you always need
it.
This is particularly true if you are managing databases. You need to be able to answer questions like "am I running out of disk?" or "why does my application have degraded performance?" to be able to troubleshoot or mitigate problems before they occur.
When I first made a foray into how to monitor PostgreSQL in Kubernetes, let alone in a containerized environment, I learned that a lot of the tools that I had used previously did not exactly apply (though keep in mind, that foray was awhile back -- things have changed!). I found myself learning a whole new tech stack for monitoring, including open source projects as Prometheus and Grafana.
I also learned how I took for granted how easy it was to collect information like CPU and memory statistics in other environments. In container world this was a whole different ballgame, as you needed to get this information from cgroups. Fortunately for me, my colleague Joe Conway built a PostgreSQL extension called pgnodemx that reads these values from within PostgreSQL itself. Read more about pgnodemx.
And then there is the process of getting the metrics stack set up. Even with my earlier experiments on setting up PostgreSQL monitoring with Docker, I knew there was more work to be done to make an easy-to-setup monitoring solution in Kubernetes.
All this, combined with the adoption of the PostgreSQL Operator, made us want to change how we support monitoring PostgreSQL clusters on Kubernetes. We wanted to continue using proven open source solutions for monitoring and analyzing systems in Kubernetes (e.g. Prometheus, Grafana), introduce support for alerting (Alertmanager), and provide accurate host-style metrics for things like CPU, memory, and disk usage.
In other words, we wanted to fully support pgMonitor for Kubernetes.
As such, the key introduction in the PostgreSQL Operator 4.5 release is a revamped monitoring system.
Which leads us to...
Setting Up Monitoring for the PostgreSQL Operator
PostgreSQL Operator 4.5 introduces a new installation method, which includes changes in software components and a simplified configuration. The PostgreSQL Operator now uses the upstream containers for Prometheus, Grafana, and Alertmanager, which makes it easier to deploy the Postgres Operator monitoring stack in existing environments.
You can install the PostgreSQL Operator monitoring stack in a few different ways:
- Via the PostgreSQL Operator installer (pgo-deployer container)
- Via Helm
- Via Ansible
and others.
On certain environments (e.g., Minikube, Code Ready Containers), assuming you have already installed the PostgreSQL Operator, installation may be as simple as:
kubectl apply -f https://raw.githubusercontent.com/CrunchyData/postgres-operator/v4.5.0/installers/metrics/kubectl/postgres-operator-metrics.yml
It may be necessary to tweak some of the configuration, particularly around the storage options for Prometheus and Grafana.
Once Prometheus, Grafana, and Alertmanager are deployed, log into Grafana. To access Grafana in my test environment, I typically set up a port-forward like so:
kubectl -n pgo port-forward svc/crunchy-grafana 3000:3000
Let's start collecting some data. For this example, I provisioned a few Postgres clusters, some with high availability, like so:
pgo create cluster hippo --metrics --replica-count=1
pgo create cluster rhino --metrics --replica-count=1
pgo create cluster zebra --metrics
Note the use of the --metrics flag: this deploys the crunchy-postgres-exporter sidecar with each Postgres instance. This is used to collect the metrics scraped by Prometheus and later visualized by Grafana.
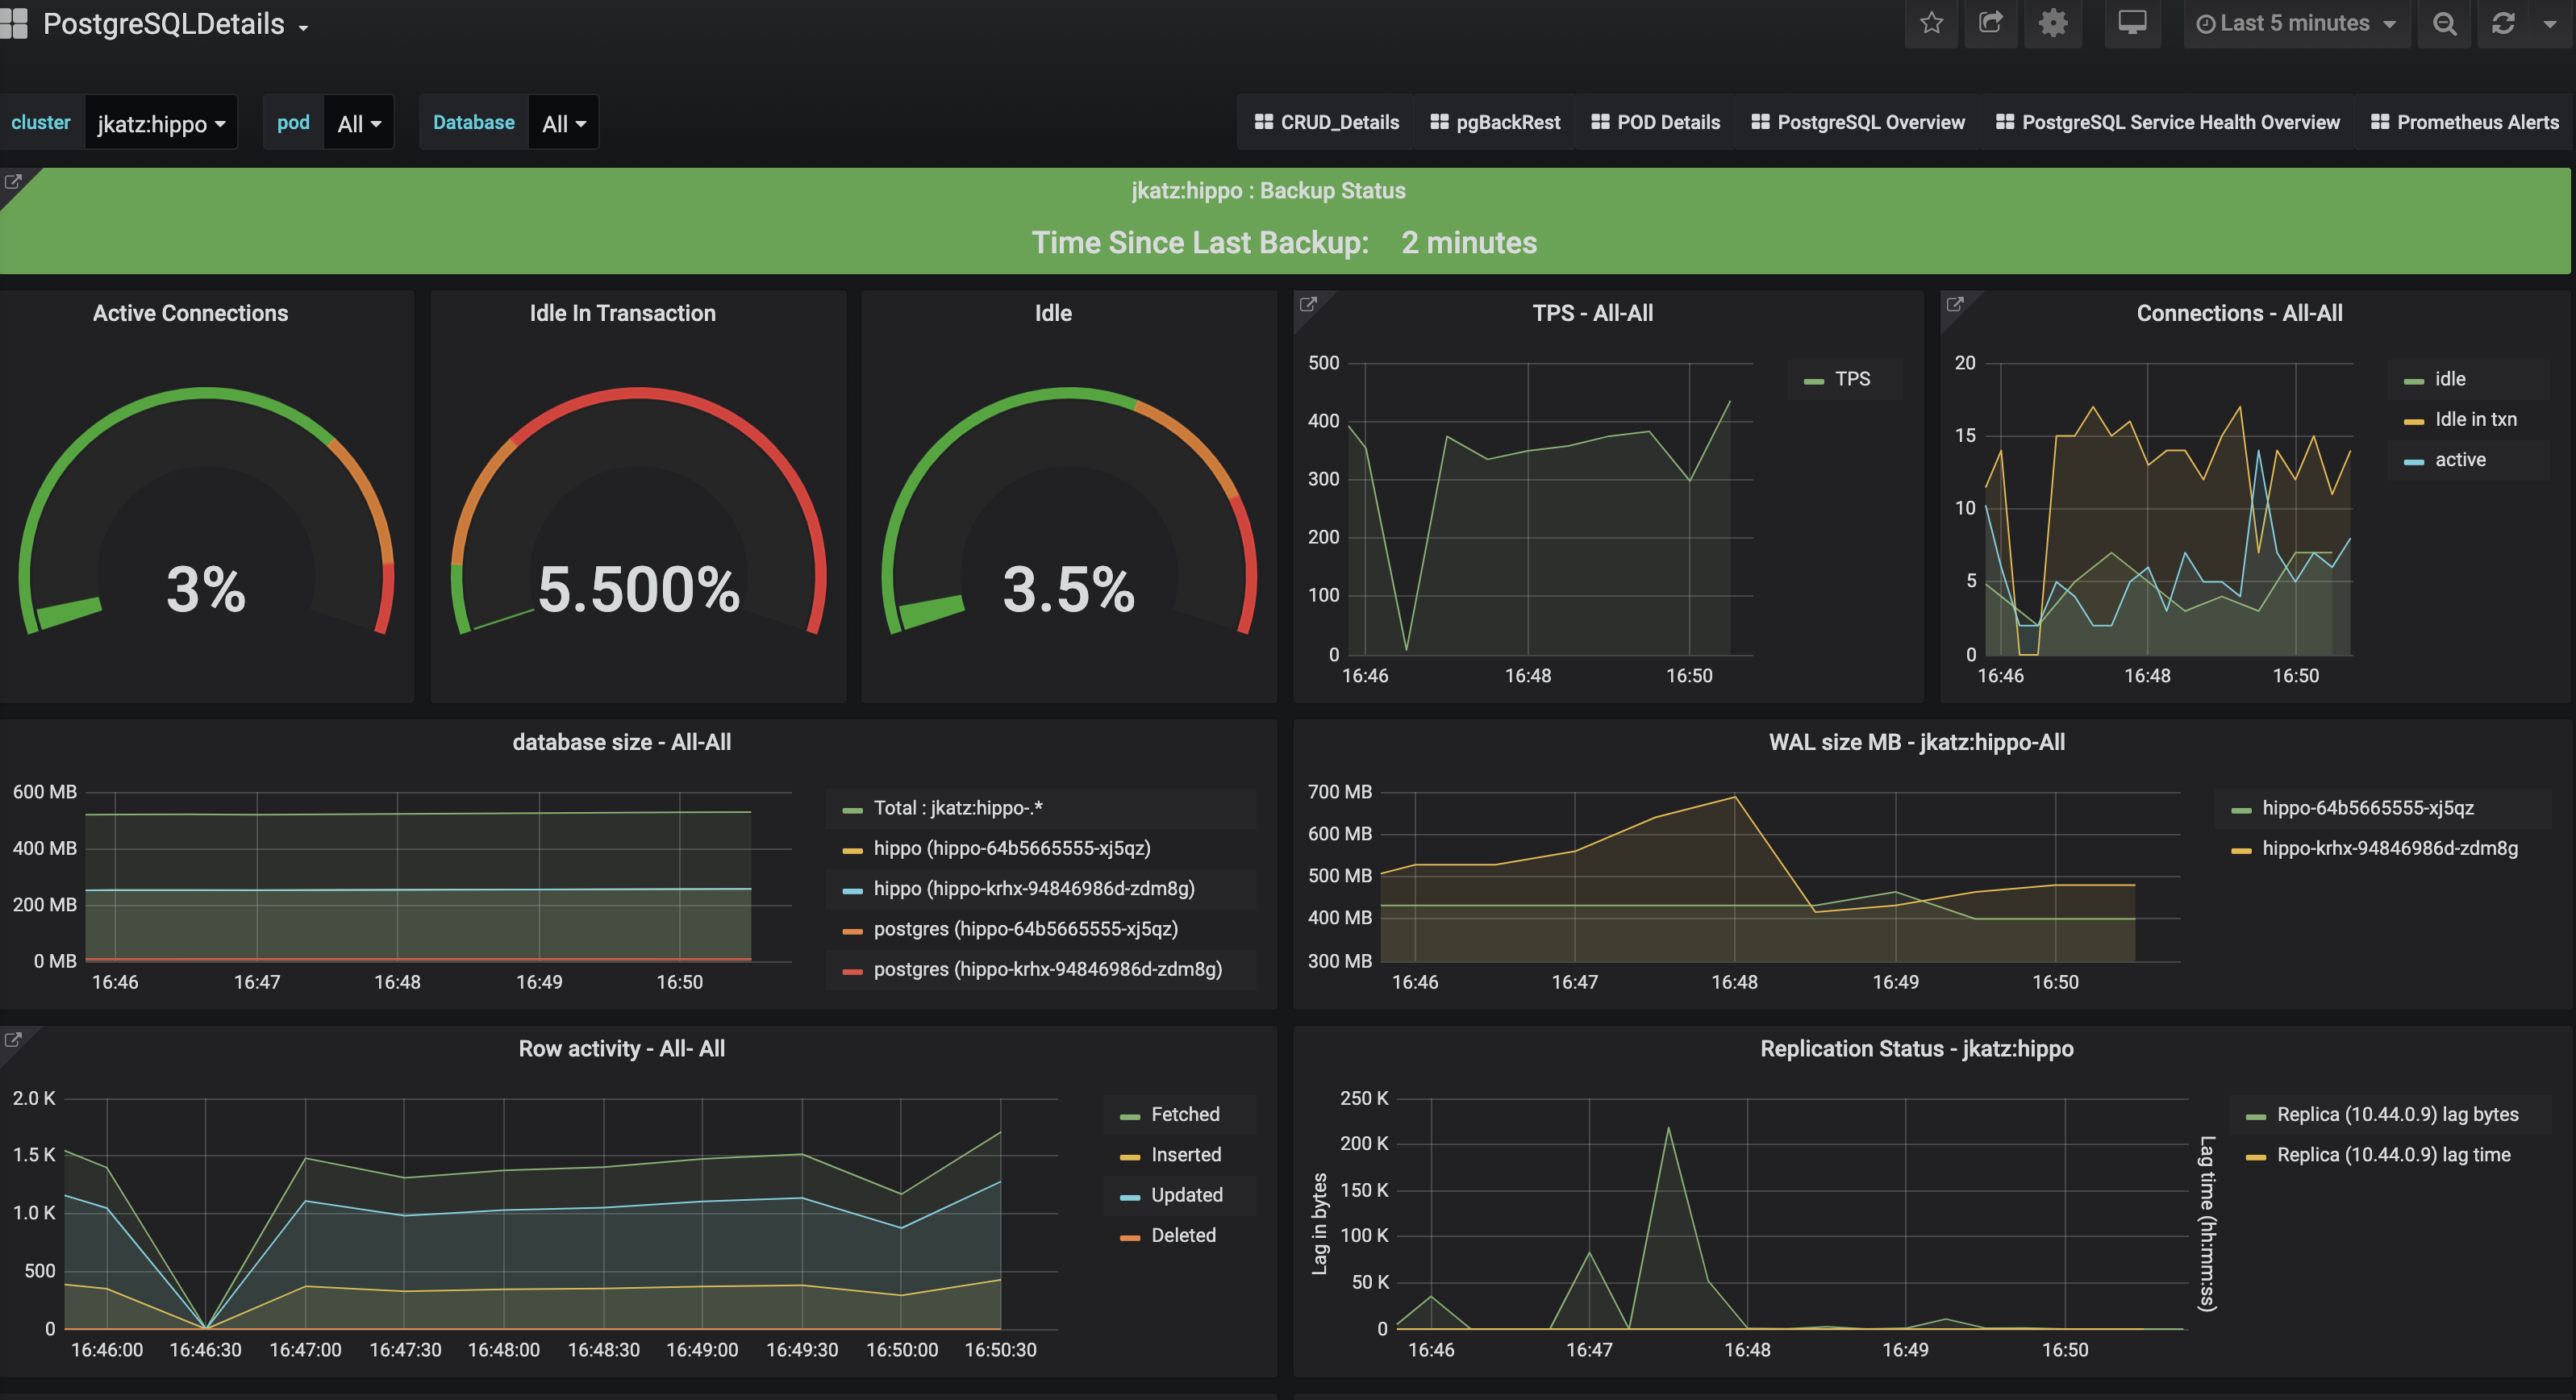
After a bit of time and activity, check back with Grafana, you will see your dashboards populating with data:
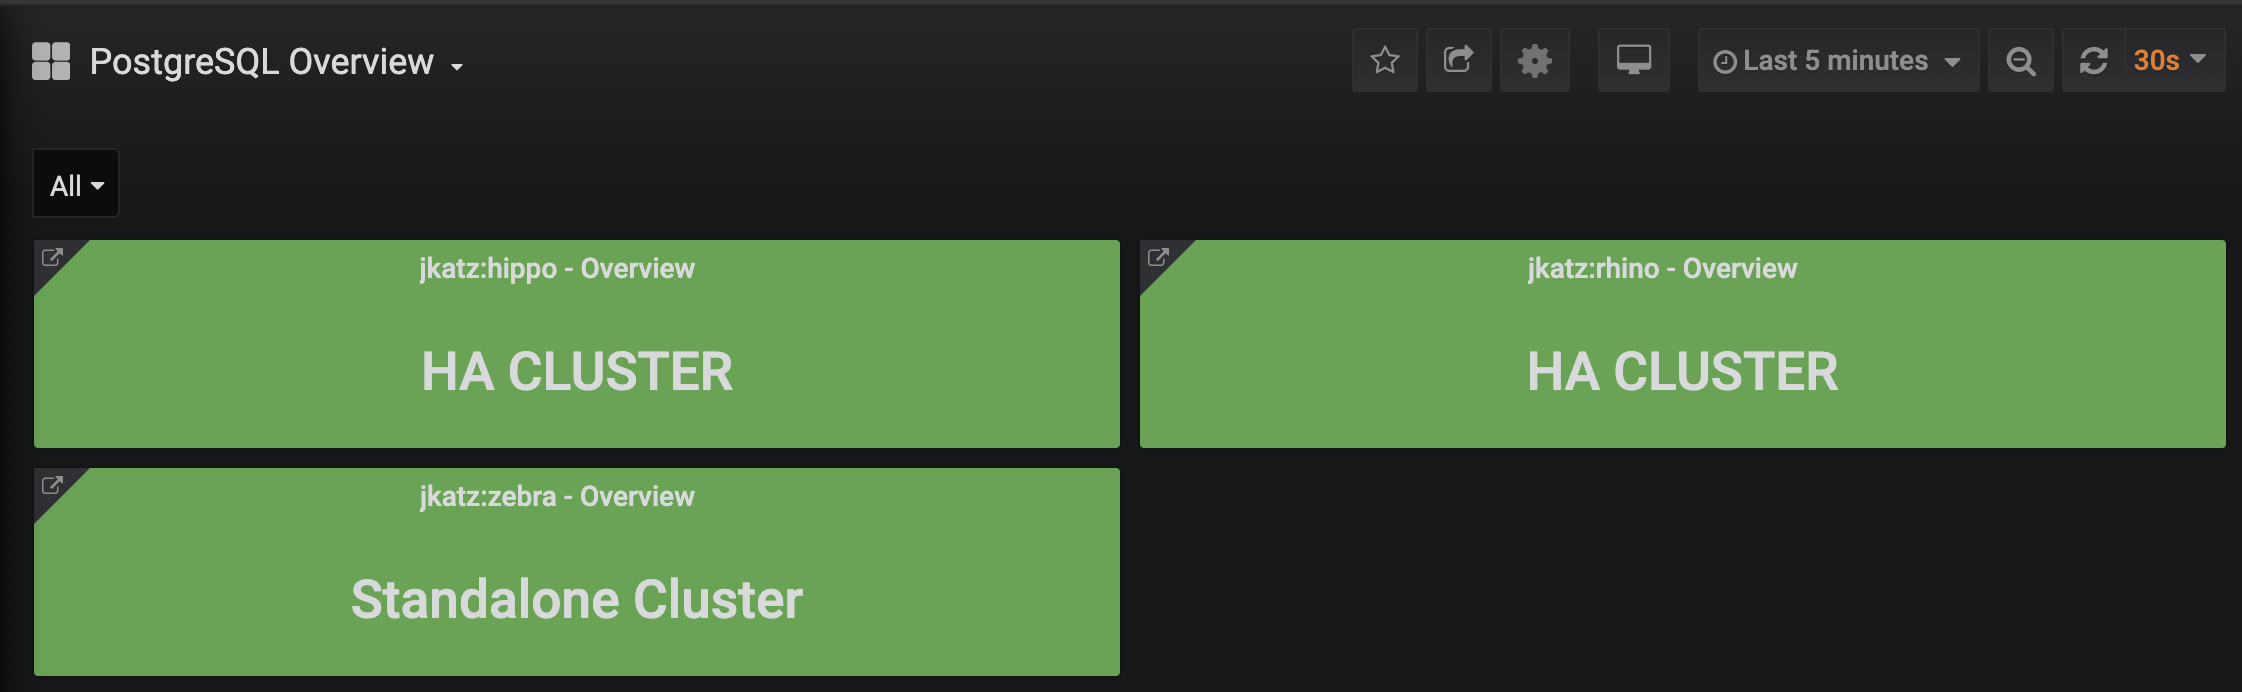 You can click on the cluster names to drill in further.
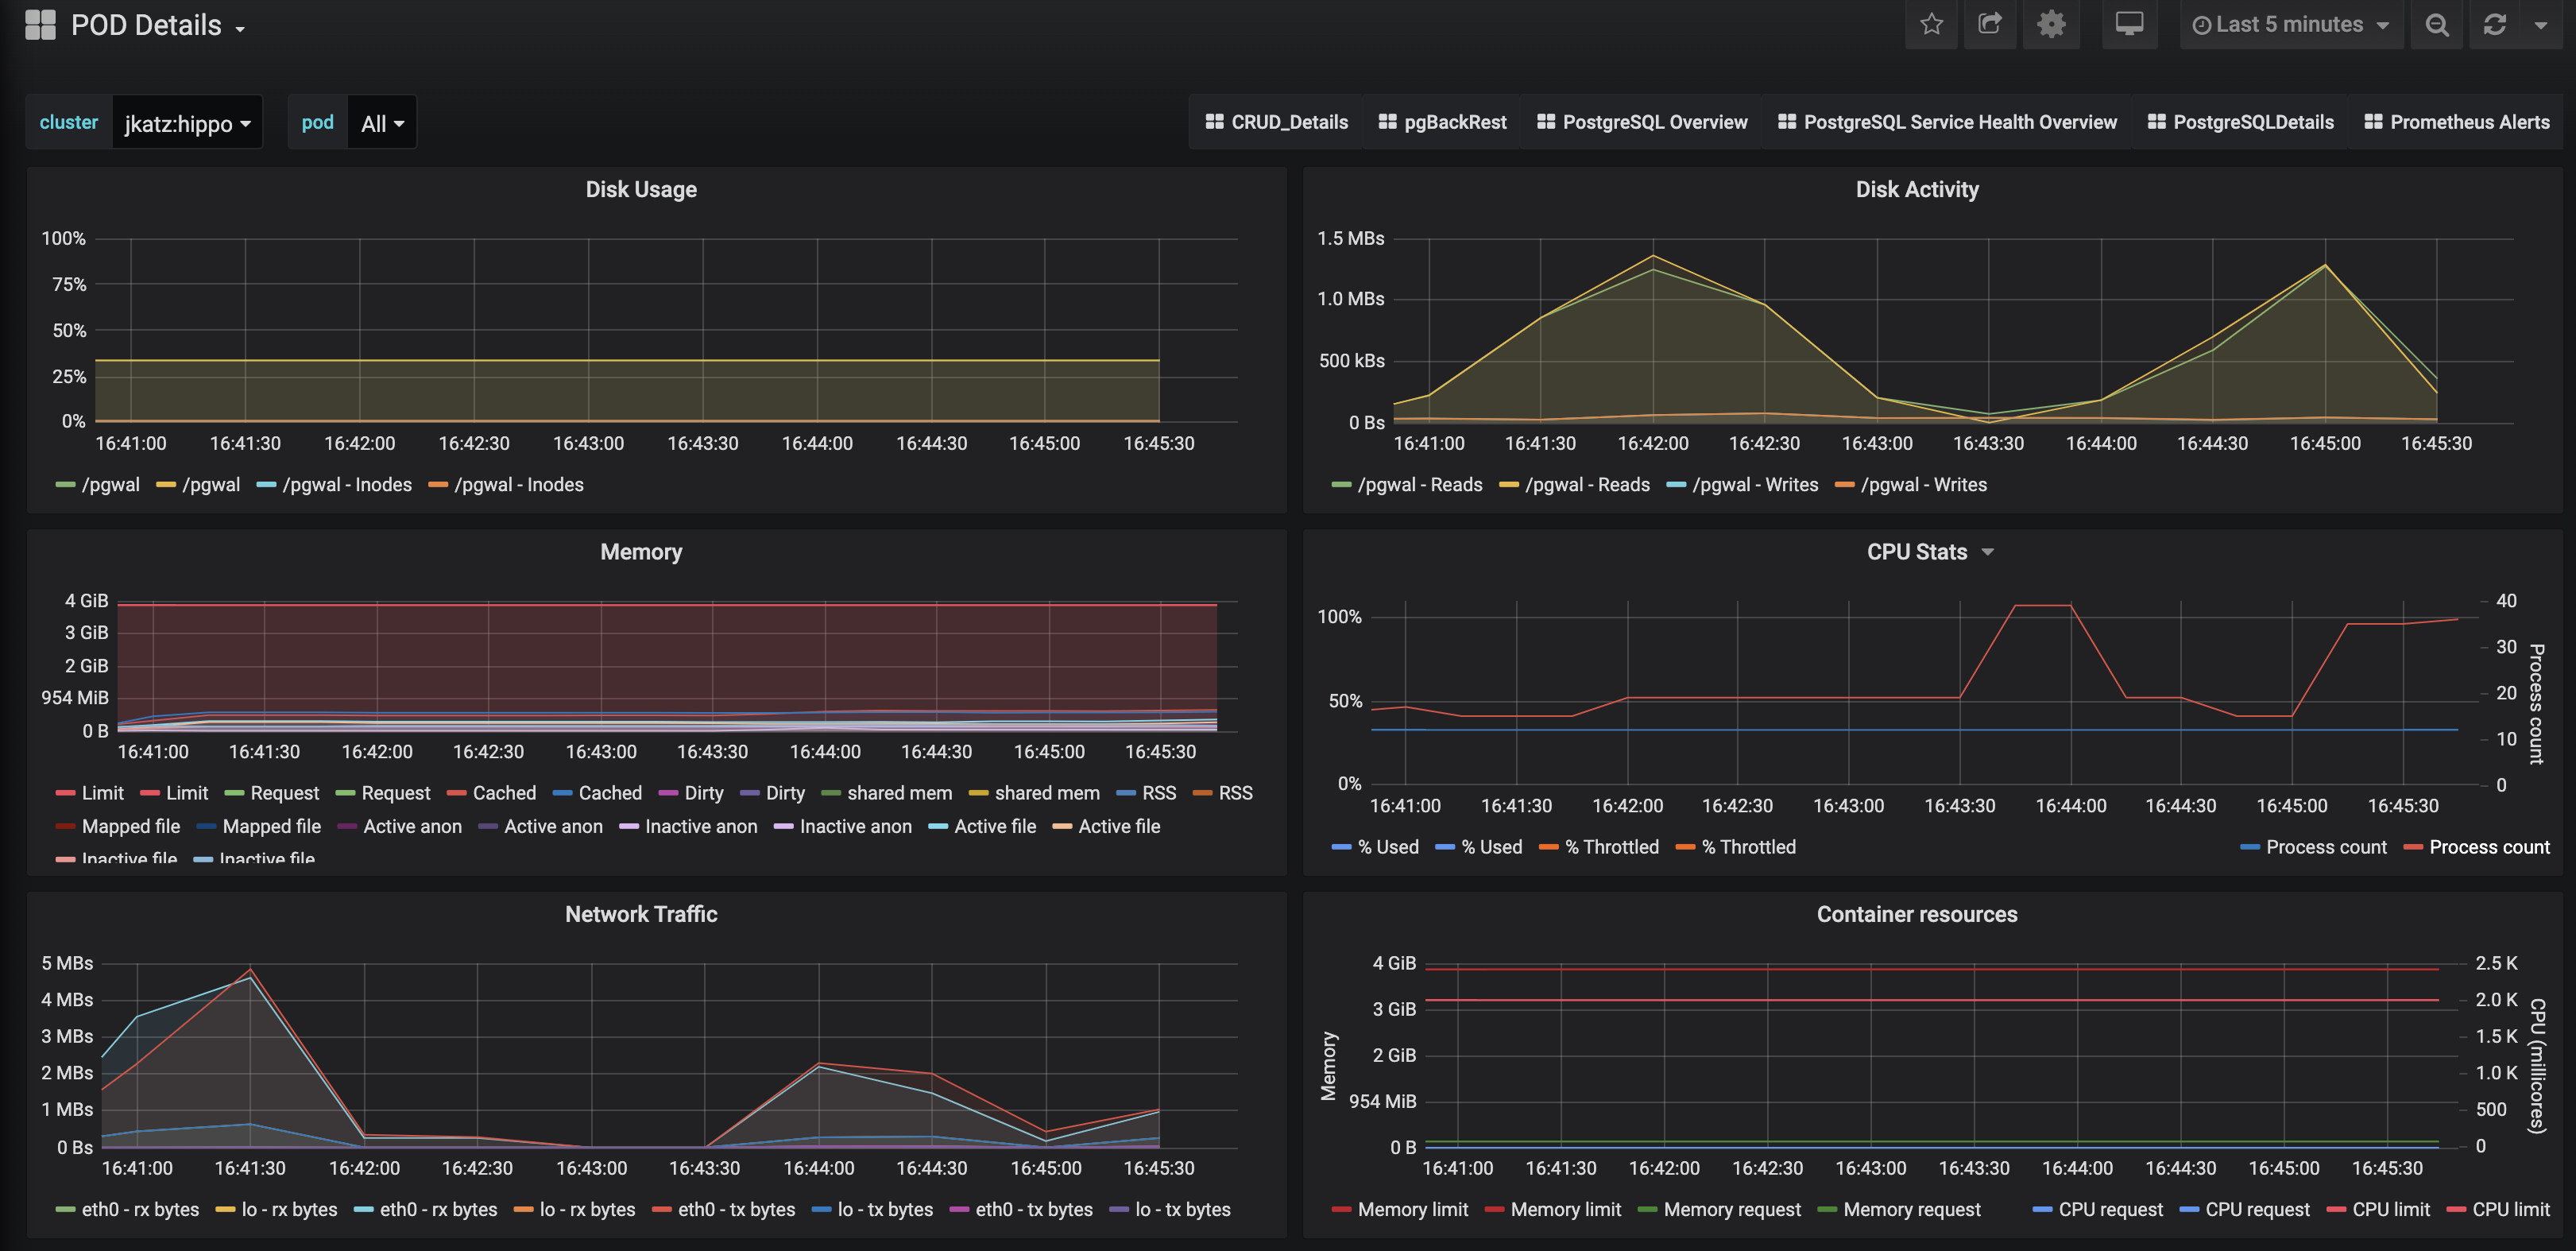
One of my favorite dashboards is the one that shows the Pod specific data, including CPU, memory, and disk utilization!
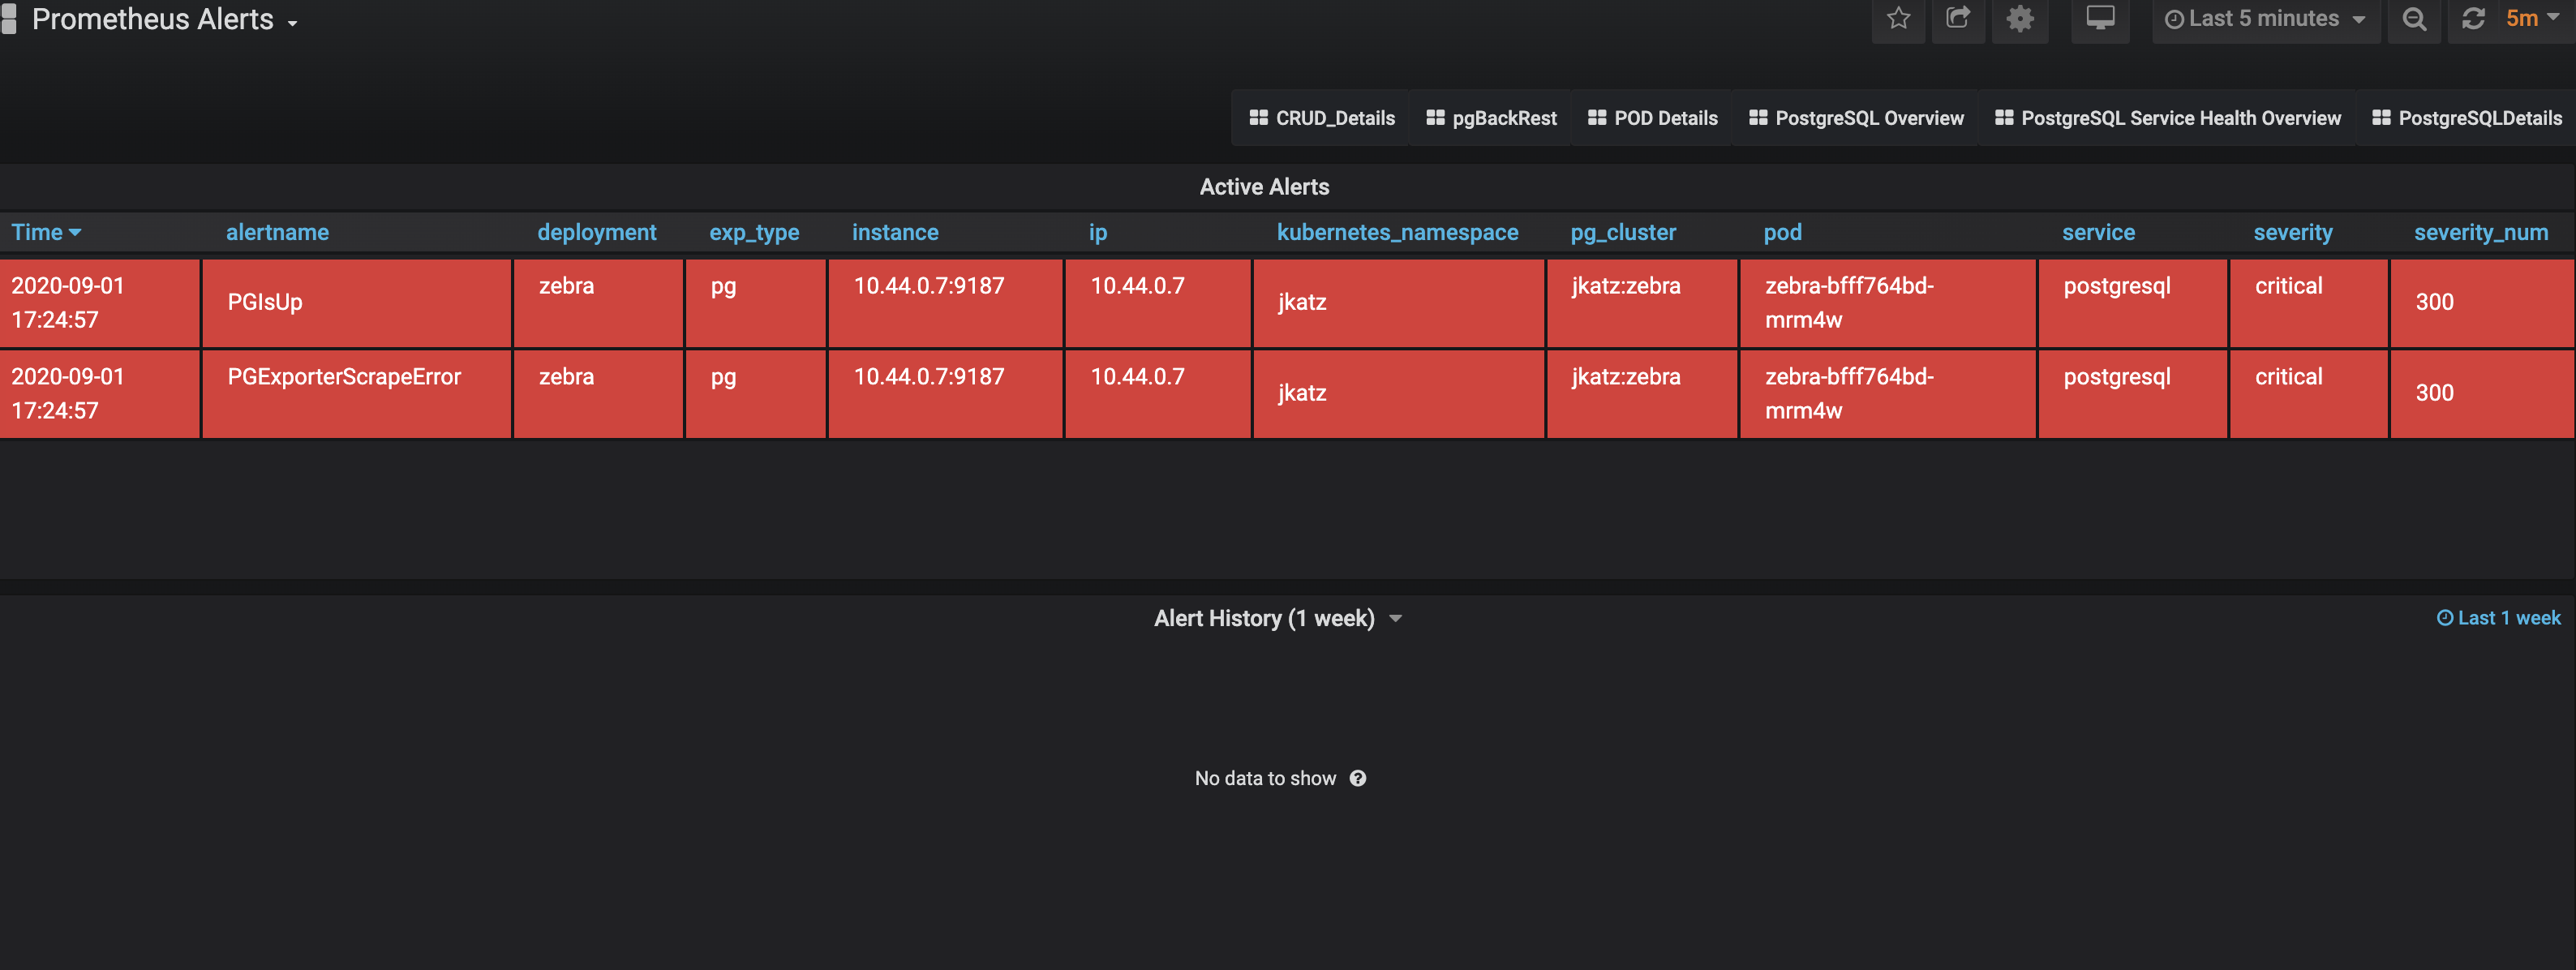
 The Alertmanager integration has garnered a lot of excitement: there are alerts
that:
The Alertmanager integration has garnered a lot of excitement: there are alerts
that:
- Indicate that a cluster is down
- Warn that a database is running out of disk
- Caution that a replica is lagging behind too much
and many more!
 The best part of all of this is that it was pretty easy to set up, so you can
use the PostgreSQL Operator monitoring stack in development, test, and
production environments.
The best part of all of this is that it was pretty easy to set up, so you can
use the PostgreSQL Operator monitoring stack in development, test, and
production environments.
Next Steps
It's one thing to get monitoring up and running: it's another thing to interpret them. While PostgreSQL performance analysis could fill a book (and has), I will be publishing some upcoming articles on how to interpret some of the visualizations that come with the PostgreSQL Operator monitoring stack.
This article is part of a series:
