Logging Tips for Postgres, Featuring Your Slow Queries
In the last several months, we've featured simple yet powerful tools for optimizing PostgreSQL queries. We've walked through how the pg_stat_statements extension can show which queries are taking up the most time to run system-wide. We've also looked at how to use the EXPLAIN command to uncover query plans for individual queries.
You can get a lot out of those two, but you may have also wondered, "What about logs? Surely I can use Postgres' logs to help me find and track slow queries too?" Today we're going to take a look at a useful setting for your Postgres logs to help identify performance issues. We'll take a walk through integrating a third-party logging service such as LogDNA with Crunchy Bridge PostgreSQL and setting up logging so you're ready to start monitoring and watching for performance issues.
Logging your slow queries with log_min_duration_statement
With pg_stat_statements, you have to query the view periodically, while logging works a bit more behind the scenes. Pg_stat_statements also works well for analyzing queries in the aggregate, but you may want to see the exact queries that took a long time to run individually.
The
log_min_duration_statement
configuration parameter allows Postgres to do some of the work in finding slow
queries. You decide the threshold, and the server logs the SQL statements that
take at least that much time to run. In this example, I'll say 0.1 seconds,
although figuring out that threshold is going to be specific to your case.
So if I have a database named us in a Crunchy Bridge cluster, I can run the following as a super user:
ALTER DATABASE us SET log_min_duration_statement = '100ms';
Your minimum duration might be higher based on the types of queries running. If you set it at too low of a number, you could end up with too much logging information than is actually helpful. Logs also take up space, so that's another thing to consider.
Crunchy Bridge clusters have syslog enabled as a log destination, so server logs can be exported to a third party logging service. Crunchy Bridge in particular can integrate with most providers that support syslog-ng.
When you use a service such as LogDNA, your account is typically associated with an access key for integrations. You may see this being referred to as an ingestion key, API key or token. LogDNA uses two types of API keys: ingestion keys for sending data to LogDNA, and service keys to send data from LogDNA.
LogDNA integration for Crunchy Bridge
The following steps assume that you've already set up a LogDNA account and are logged in via their web app. (They have a Quick Start guide for your reference. You only need to get to the step where you set up an organization and get an automatically-generated ingestion key.)
-
In your LogDNA account, open the Manage Organization page and retrieve your Ingestion Key under "API Keys."
-
On your Crunchy Bridge dashboard, select a cluster, and navigate to the Logging tab. Select "Add Log Destination."
-
In the "Create log destination" window, fill out the fields with these values:
-
Host: syslog-a.logdna.com
-
Port: 6514
-
Message template (includes your Ingestion Key):
<${PRI}>1 ${ISODATE} ${HOST} ${PROGRAM} ${PID} ${MSGID} [logdna@48950 key=\"INSERT-YOUR-INGESTION-KEY-HERE\"] $MSG\nFor example, my message template looks like this:
<$PRI>1 $ISODATE $HOST $PROGRAM $PID $MSGID [logdna@48950 key=\"17dcbad54b86a51585fdfa403d801668\"] $MSG\n
-
-
Description: A brief description for your reference.
Once you save this log destination, your Crunchy Bridge Postgres cluster is added as an ingestion source for your organization in LogDNA. There's nothing else you need to do in Bridge nor LogDNA to enable the integration.
Spotting slow queries in your Bridge logs
Head over to the official Crunchy Bridge docs for more details on what the data will look like in LogDNA. For this example, I have queries running against United States placenames data in a geonames table. Here, we'll take a look at an extract from my LogDNA viewer that shows the SQL statements that were logged:
Apr 13 21:19:25 c6p3j5s7evattiqewf7al52hzu postgres info [16-1] 2021-04-14 01:19:25.389 GMT [3086911][client backend][4/0][0] [user=postgres,db=us,app=psql] LOG: duration: 226.904 ms statement: SELECT name, type, lon, lat FROM geonames WHERE name LIKE 'Spring%';
Apr 13 21:19:42 c6p3j5s7evattiqewf7al52hzu postgres info [17-1] 2021-04-14 01:19:42.418 GMT [3086911][client backend][4/0][0] [user=postgres,db=us,app=psql] LOG: duration: 120.019 ms statement: SELECT name, type, lon, lat FROM geonames WHERE name LIKE 'Middletown%';
Apr 13 21:19:55 c6p3j5s7evattiqewf7al52hzu postgres info [18-1] 2021-04-14 01:19:55.433 GMT [3086911][client backend][4/0][0] [user=postgres,db=us,app=psql] LOG: duration: 134.442 ms statement: SELECT name, type, lon, lat FROM geonames WHERE name LIKE 'Spring%';
Apr 13 21:20:05 c6p3j5s7evattiqewf7al52hzu postgres info [19-1] 2021-04-14 01:20:05.110 GMT [3086911][client backend][4/0][0] [user=postgres,db=us,app=psql] LOG: duration: 136.167 ms statement: SELECT name, type, lon, lat FROM geonames WHERE name LIKE 'Tampa Bay%';
c6p3j5s7evattiqewf7al52hzu is the Crunchy Bridge host, the app/process is
postgres, and queries that ran for at least 100ms are logged at the info
level. The Bridge logs are updated in LogDNA in pretty much real time.
Log messages from Crunchy Bridge Postgres also include a log line prefix based on this format:
%m [%p][%b][%v][%x] %q[user=%u,db=%d,app=%a]
Let's break that down a little bit:
%m: Time stamp with milliseconds -2021-04-14 01:19:25.389 GMT[%p]: Process ID -[3086911][%b]: Backend type -[client backend][%v]: Virtual transaction ID (backendID/localXID) -[4/0][%x]: Transaction ID (0if none is assigned) -[0]%q: Produces no output, but tells non-session processes to stop at this point in the string; ignored by session processes%u,%d,%a: User name, database name, application name -[user=postgres,db=fakedb,app=[unknown]]
The default log line prefix for Postgres includes just the time stamp and process ID. But with Bridge log messages, you immediately see more information about that particular process. Your logs are more readable right off the bat.
I also just ran these queries in psql but you could have them running via a different client or from your own application. The log messages would indicate as such too.
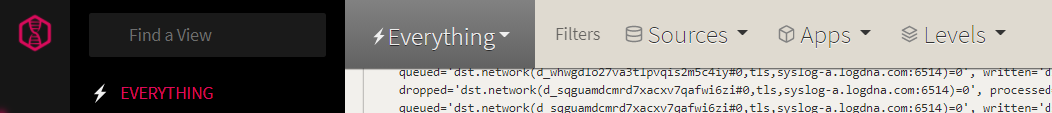
Filtering and views in LogDNA
There's plenty you can do in the LogDNA app in terms of searching, parsing, and even visualizing logs, but for now let's try a couple of simple log management features in the web app.
Filtering
By default, the LogDNA viewer displays all logs from all your organization's ingestion sources. At the top of the page, you can quickly filter on:
- Hosts (Ingestion source)
- Apps (App or program), e.g.
postgres,syslog-ng - Levels (e.g.
INFO,NOTICE,DEBUG,WARN,ERR)
On the bottom of the page is a search field - any search terms you enter here can be saved together with the page filters in a new view, for your convenience.
Views
As an example, I've created a basic view to show slow queries:
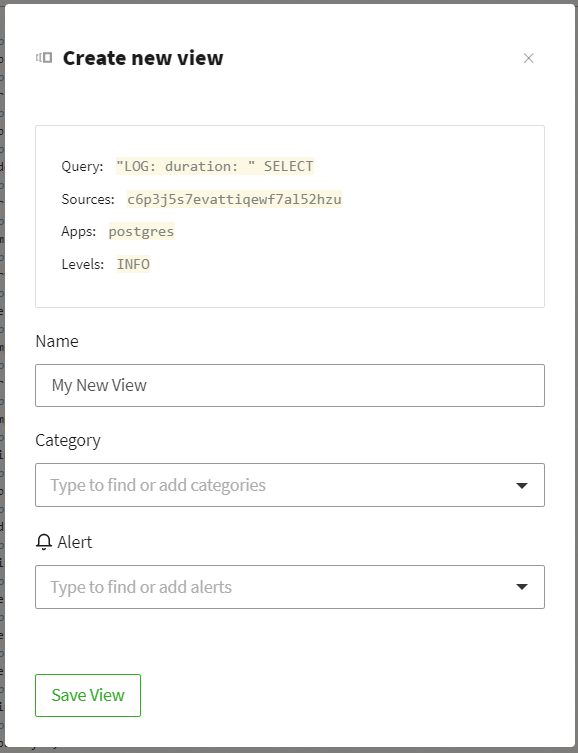
I've filtered on the Crunchy Bridge host, postgres as the app, and the info
level. Let's also say I only want SELECT statements to be included in this
view. "LOG: duration: " SELECT as my search query is sufficient to capture
those logged SQL queries.

No, I don't plan on watching my views like this guy… maybe.
You can get even more granular with your views. The official docs on search in LogDNA are helpful, and for a deeper dive into LogDNA's approach to search, check out this blog post on regex vs. search terms. To learn more about working with and viewing logs, visit the official LogDNA docs.
OK, where to from here?
I've only run pretty basic queries against a test database for this example. A more complex, production-level system has more requirements and so your logging and monitoring setup might be much more involved. But hopefully this shows you how it takes not much work at all to get this kind of integration up and running with Crunchy Bridge.
So, I appear to be seeing some slowness with a particular statement. Great, now
what? This could be a point where I check pg_stat_statements to see how the
parameterized version of this query
(SELECT name, type, lon, lat FROM geonames WHERE name LIKE $1) has performed
in terms of total or even average execution time. Or, I could dive into
EXPLAIN to see the query plans and have a better idea for how the query could
be optimized.
Figuring out why queries are slow and what should be done to fix them is a whole
other layer, so we'll fast forward a bit. Let's say I decide to add just a
standard B-tree index for the geonames.name column.
CREATE INDEX on geonames(name);
Adding this index dropped those same queries down from >100ms to no more than
several milliseconds, according to EXPLAIN ANALYZE. I'd probably keep an eye
on the logs as well as pg_stat_statements to see if this optimization holds up
well over time. And even if it doesn't, or if new trends start to come up, a)
I'll be able to see that pretty easily, and b) I know I have the tools as well
as the data to dig into. If nothing else, it's always possible that I just need
to be writing better queries...
Something I didn't do in this example but I learned about from my colleague
Craig Kerstiens is
log_temp_files.
There is a
work_mem
configuration that sets how much memory Postgres can use on a given process for
a query. When that amount isn't enough, Postgres begins to spill to disk, i.e.
write temp files. When log_temp_files is set to 0, the server logs each time a
temp file is written. If you start to see a lot of that in your logs, that might
indicate that work_mem needs to be increased.
The folks at LogDNA have done a great job of spelling out why you may want to manage your logs in a central place, and how logging can be part of a more proactive approach to incident prevention. Logging is obviously for more than just fixing slow queries. But, this could be part of a query optimization strategy that works well for you. Thoughts? Let us know on Twitter @crunchydata.
